« Zona Intangible Tagaeri Taromenane – Mapas en Plos ONE

Figure 7

Fig. 7 - Synthesis map of the critical zone around points No. 5, 6 and 7 of the perimeter section: spatial relationships between oil production (block 16), home range of uncontacted Maxus group, and the spot of the Tagaeri Taromenane attack occurred on the 5th March 2013. This synthesis map of the critical zone defined by points No. 5, 6, 7 of the Zona Intangible show sensible spatial relationships between oil production (blocks, fields and wells), the home range of uncontacted Maxus clan, the ZITT perimeter and the Waorani communities settlements. Spatial relationships between oil production areas and the Zona Intangible perimeter section are clearly shown in the map. The attack has major significance in terms of its location since it occurred near the geographic inconsistencies highlighted by this paper: about 100 meters from the Wipsi-1 oil platform, 10 km from point 7, almost 20 km from point 7, along the border of the Buffer Zone. Background raster map has been assembled using a SRTM DEM model to also show geomorphological characteristics of the area.

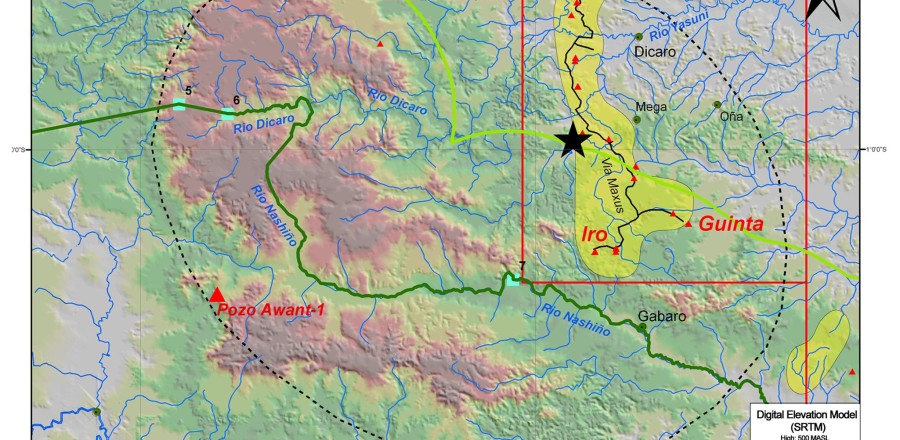
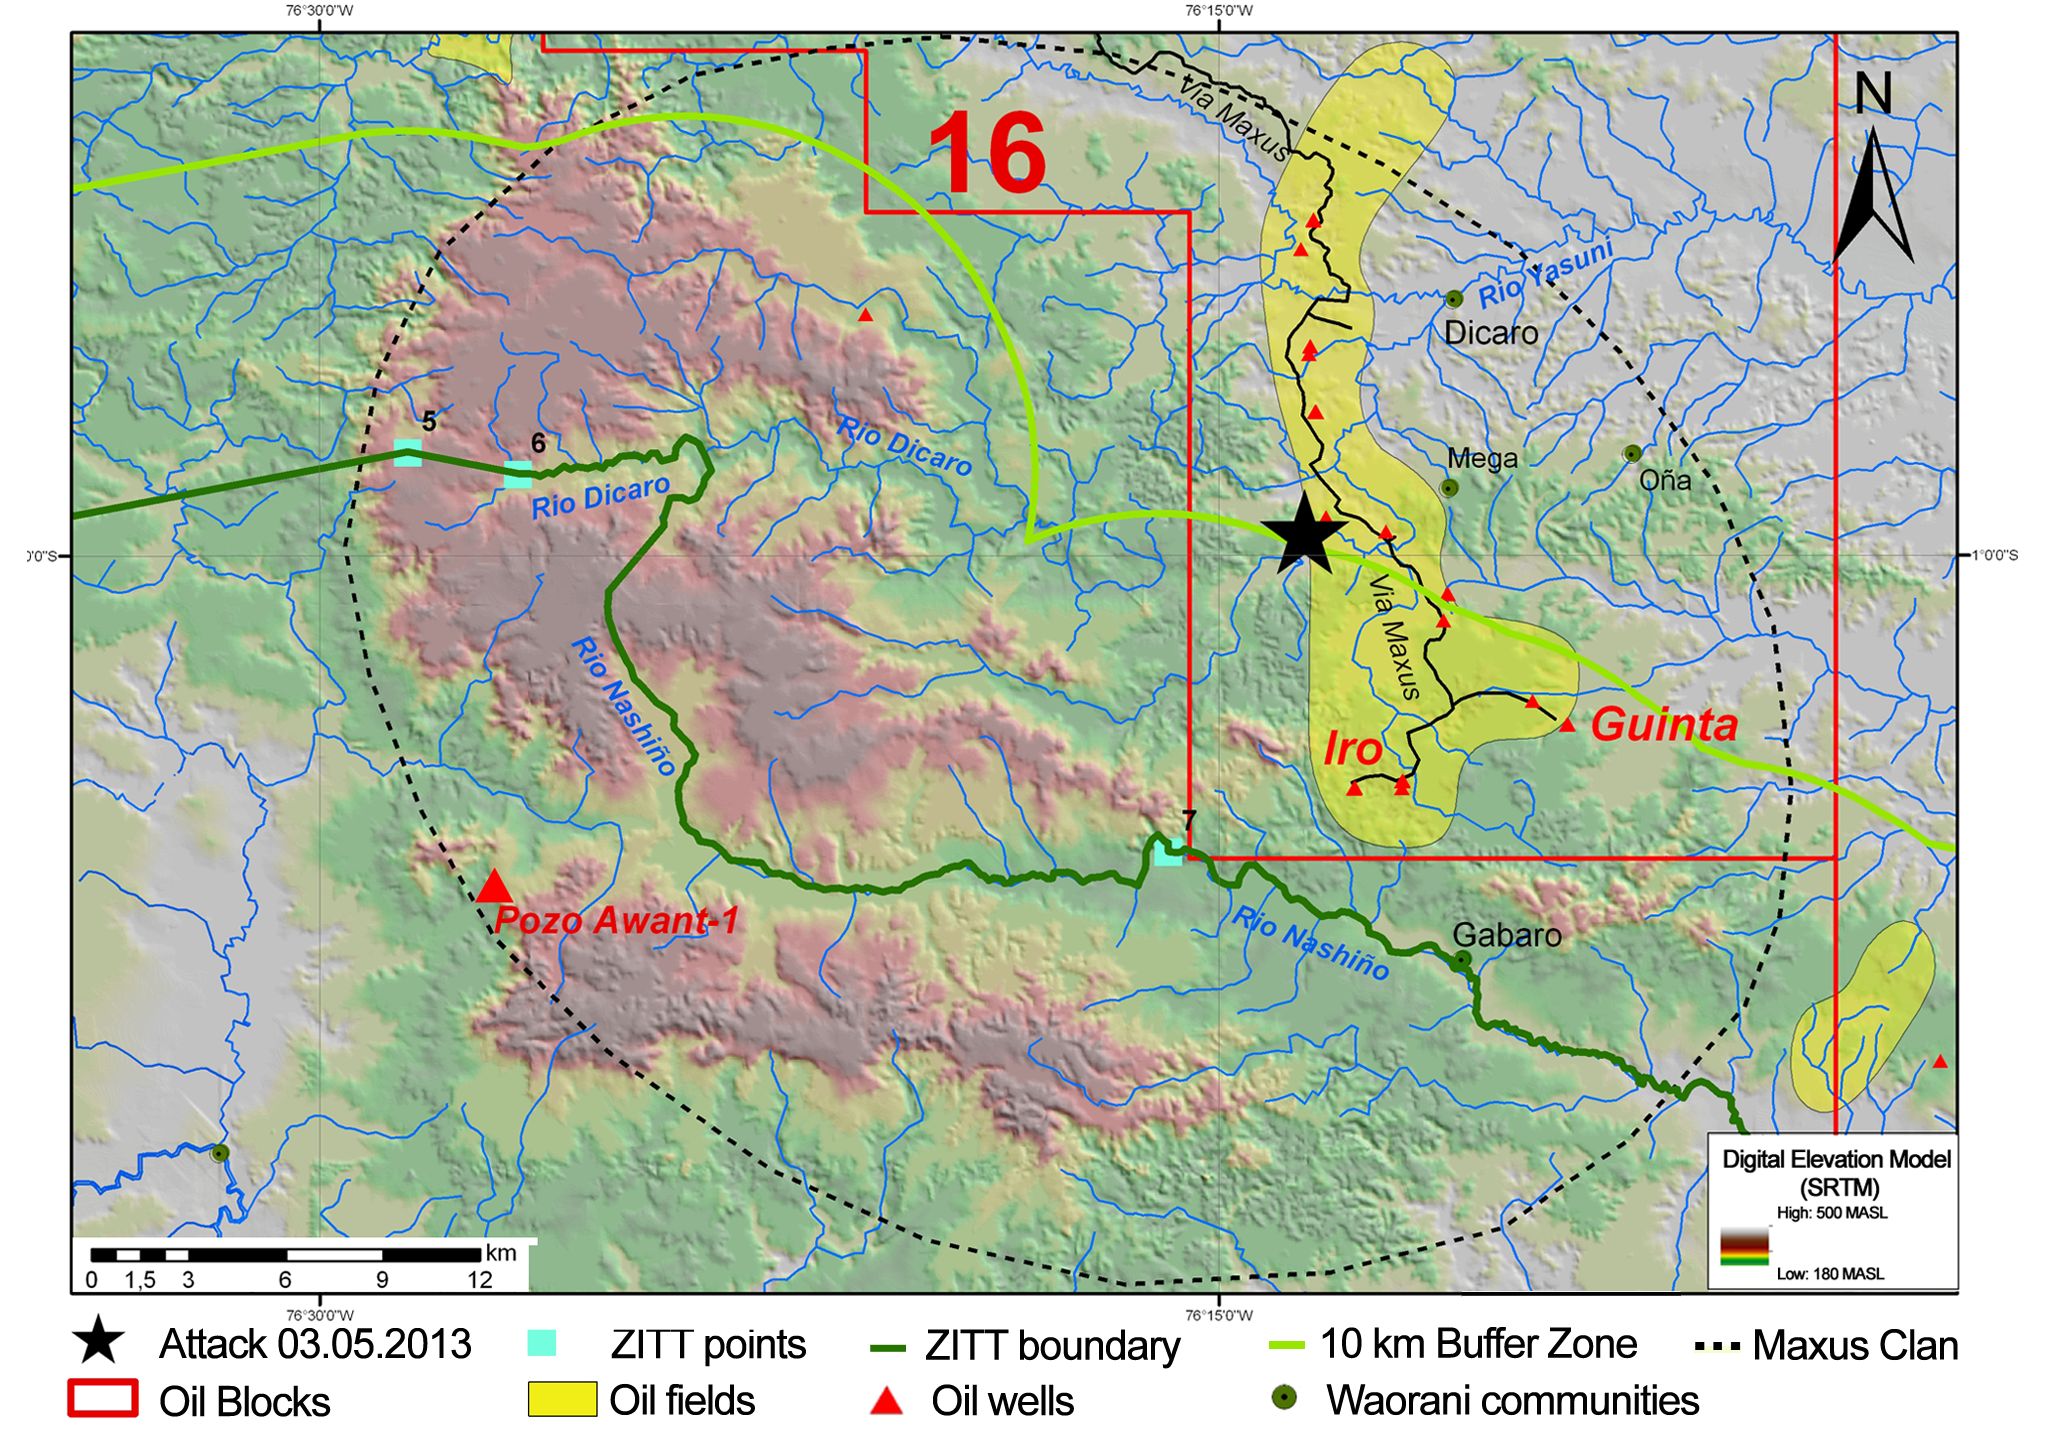
Fig. 7 – Synthesis map of the critical zone around points No. 5, 6 and 7 of the perimeter section: spatial relationships between oil production (block 16), home range of uncontacted Maxus group, and the spot of the Tagaeri Taromenane attack occurred on the 5th March 2013. This synthesis map of the critical zone defined by points No. 5, 6, 7 of the Zona Intangible show sensible spatial relationships between oil production (blocks, fields and wells), the home range of uncontacted Maxus clan, the ZITT perimeter and the Waorani communities settlements. Spatial relationships between oil production areas and the Zona Intangible perimeter section are clearly shown in the map. The attack has major significance in terms of its location since it occurred near the geographic inconsistencies highlighted by this paper: about 100 meters from the Wipsi-1 oil platform, 10 km from point 7, almost 20 km from point 7, along the border of the Buffer Zone. Background raster map has been assembled using a SRTM DEM model to also show geomorphological characteristics of the area.

Aggiungi ai preferiti : permalink.

Lascia un Commento